
 Analysis · BitStream Visual
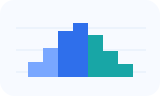
Histogram
Explore how numeric values are distributed across ranges.
Open Histogram ↗Sign in or create a free account to get started.Make it your own
Explore how numeric values are distributed across ranges. Your workspace keeps the controls specific to the activity you choose.
- Open the tool and sign in to your account.
- Edit the sample data or import your own CSV, XLSX or JSON file.
- Save your project, share a view link or export your work.
Free accounts include 5 saved projects. See current access and storage limits.